America's favorite pastime undergoes a fusion with the dismal scienceOctober 27, 2017By Peter Scharf
I am a huge baseball fan. I have been watching the MLB-particularly my hometown Philadelphia Phillies-regularly since I was 8 years old. I have attended 50-75 games and watched my boys in red pinstripes play in the National League Division Series, National League Championship Series, and ultimately the World Series. My passion for baseball has not waned since I stopped playing in high school, and, if anything, has increased. My perspective on the game has changed significantly though. Through the coursework of an economics degree, I have gained the skills to not only observe baseball as an outsider, but take my own approach and analyze every player, every game, and every offseason signing. Taking the ideas of economics and combining them with baseball fandom is nothing new, however. Economics has had a grip on baseball since even before my Little League Days.
Economics complements baseball due to the statistics driven nature of the academic field. Baseball is arguably the most stat-driven sport. Baseball executives have begun using similar techniques that a professional economist or business analyst would use and apply them to baseball player acquisition. Game theory has also very recently begun to creep into the world of baseball. While a simplified version of game theory has been in use since the 1800s, today batting coaches and hired analysts are determining to try to compute a pitcher’s move and the batter’s response.
Throughout this piece, I will assume that you have some basic knowledge of the game of baseball. I, however, do not assume you know the full glossary of baseball statistics. Thus, I include the official list of MLB statistics.
A Brief History of Baseball Analytics
Baseball statistics have been around since the 1850’s1 when avid baseball fans could find a player’s batting average, walks, home runs, doubles, triples, and singles through simple arithmetic and analysis of a game’s complete box score. Little changed in the baseball world throughout the next century. While baseball executives certainly used these simple statistics to gauge a potential trade acquisition or draft pick, it was the subjective opinion of a scout who had the most weight.

While scouts insist on drafting taller pitchers. No statistically significant correlation can be found between height (as a function of inches) and pitcher effectiveness.16
Modern baseball statistics, or sabermetrics, began in the 1980s when Bill James, an avid baseball fan and writer, began to publish The Baseball Analyst2. Bill James and other baseball statisticians, known as sabermetricians, were trying to solve issues with traditional measurements. For example, batting average was a great way to find how often a hitter reached base. However, it did not account whether that hit was a single, double, or home run. Thus, slugging percentage (SLG) was created. This new statistic accounted for both, how often a player hits and what base he reached on the hit. Sabermetricians also realized that batting average and slugging percentage did not account for other ways that a player could reach base. On-base-percentage (OBP) was created to factor in walks, hit by pitches, and hits into an average. To determine the general character of a hitter they combined on base percentage and slugging (literally OBP+SLG) to create OPS. OPS is now considered the most accurate statistical representation of a hitter.
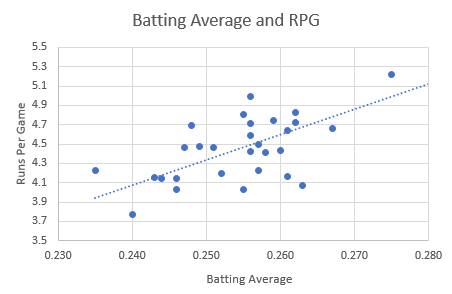
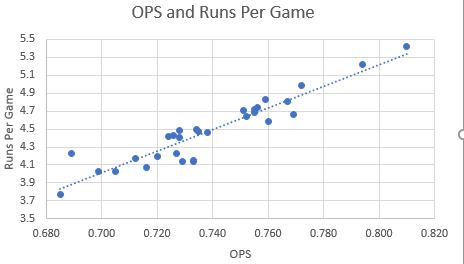 The correlation of Team Batting Average and Runs per Game vs. Team OPS and Runs per Game. Data from the 30 MLB clubs for the 2016 season.
Another advancement on the typical batting average has been the batting average on balls in play or BABIP. Batting average on balls in play considers a player’s chances of getting a hit after they hit the ball into fair territory. Pull hitters and power hitters who play into shifts often have very low BABIP. Contact and slap hitters find holes and get on base more often.
The sabermetric analysis does not end with the offensive side of the game. Sabermetrics have also expanded upon pitching and fielding. For example, rather looking at ERA which may be influenced by the fielding or perhaps lucky hits against a shift. Baseball analytics experts came up with pitcher exclusive statistics like SO/9 which effectively measures a pitcher’s strikeout rate per nine innings or DICE which only considers instances where the fielders never touch the ball like home runs, walks, strikeouts, and hit-by-pitches.
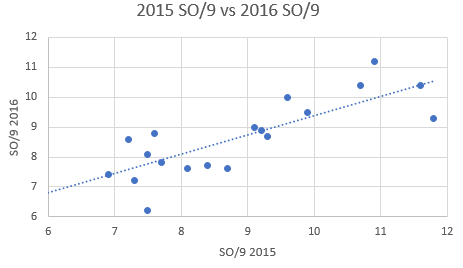
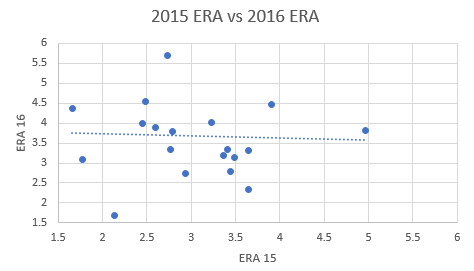 The comparison of ERA and SO/9 among 20 pitchers with more than 300 innings pitched between 2015 and 2016. Note that the ERA of the previous year has no impact on the ERA of the current. The Sabermetric statistic SO/9 has a near 1/1 relationship.
New fielding statistics like range factor have replaced the traditional fielding percentage. Fielding Percentage merely takes the percentage of the times a player fields a ball cleanly and fields it without error. Range factor takes into effect a player’s ability to cover the field. For a hypothetical example, say you have a slow outfielder who rarely gets to make a play on a ball because he is so slow. His fielding percentage may be very high (you cannot make an error if you never make it to the ball) but his range factor would give a better description of the fielder he is. To properly evaluate range factor one must take into account the position a player is fielding from. For example, a shortstop sees much more action than a first baseman.
From the ground of all these newer baseball statistics grew WAR or wins above replacement. Among sabermetricians today, WAR is the final and most accurate measure of how “good” a baseball player is. WAR is an attempt to determine how valuable a certain player is to the team. Essentially, it compares a given player to a hypothetical “replacement” who is league average in every statistic. WAR has no standard way to be calculated, rather each individual baseball statistics website calculates its own version. Rather than spend the next 10 pages discussing the ways WAR can be calculated if you are interested check out Baseball Reference and Fangraphs descriptions of WAR.
Through technological advances of the recent years, physics-based sabermetrics have begun to dominate the sport. The two most talked about are exit velocity and launch angle. Exit velocity is the speed, generally in mph, that a ball leaves the bat. Launch angle is the angle by which the ball is hit from the plate. Low launch angles result in ground balls and infield outs. High launch angles result in pop-ups. Good hits are described at having launch angles 25-35 degrees.
 Sabermetrics and How the Economists Took Over the Front OfficeSabermetrics first reached the front office of an organization with Billy Beane and the Oakland Athletics. This account is made famous because of the book and movie Moneyball3. To summarize the Oakland Athletics have some of the lowest payroll in the league. To remain competitive, GM Billy Beane, stuck to a strict sabermetric approach to try to find undervalued players that they would not have to pay as much for. Since the release of the book and movie, as well as the spread of Beane’s management tree around the league, sabermetric analysis has been taken over Major League Baseball. As a result, management offices are rushing to find the next edge.
 Former A’s GM and sabermetric pioneer Billy Beane
Billy Beane’s popularity was not just driven by a movie and book, however. During his reign from 1999-2012 (he actually started in 1995 but his drafting and acquisition decisions did not begin culminating until the late 90s) the Oakland A’s posted a .527 winning percentage from a record of 1621-1453. During this time he had over 90 wins, a great achievement in baseball, on 8 different occasions and made the postseason on 6 different occasions.8 Billy Beane and crew were also able to sabermetrically mine hidden prospects like Nick Swisher, Joe Blanton, Barry Zito, Mark Mulder, Bobby Crosby, and submarine reliever Chad Bradford.
Because of the driven towards statistics driven baseball, teams needed management that were skillful with numbers and applying them to human interaction. Consequently, economists began to fill the ranks. Of the general managers in baseball today, Matt Klentak of the Philadelphia Phillies, Dick Williams of the Cincinnati Reds, Mike Chernoff of the Cleveland Indians, Jeff Luhnow of the Houston Astros, Derek Falvey of the Minnesota Twins, Mike Girsh of the St. Louis Cardinals, Matthew Silverman of the Tampa Bay Rays, and Ross Atkins of the Toronto Blue Jays all have undergraduate degrees in economics or finance.4 The L.A. Dodgers quit beating around the bush and hired a full-on Ph.D. in Economics from the University of California, Berkeley in Farhan Zaidi. In the baseball executive world, math skills have overtaken baseball skills with only 1 current GM having played.5
 Dodger’s GM and Ph.D. economist Farhan Zaidi
Economists are not only ruling the front office. The more advanced sabermetric and baseball forecasting systems have been developed by economists. A quick scan of Fangraphs’ writers shows economists popping up everywhere.6
In the baseball executive world, math skills have overtaken baseball skills with only one current GM having played.
The by far most well-known sabermetrician not holding a team executive position is stat king Nate Silver. Before his days running the super popular FiveThirtyEight, Nate Silver first gained his statistics experience running Player Empirical Comparison and Optimization Test Algorithm or PECOTA. The goal of PECOTA was to predict the expected performance of any given baseball player or prospect either in the next season or throughout a whole career. Since its early founding, PECOTA has outperformed many established baseball forecasting systems.7
Kyle Hendricks: The Pitching Economist
To a scout or a self-described baseball expert, Cubs pitcher Kyle Hendricks has few qualities that would make you think he can pitch at the Major League level. To start, he was not a highly regarded prospect coming out of high school. He was denied scholarship offers from elite “baseball schools” and instead went to Dartmouth for academic reasons. His pitch velocity is extremely slow, most of his pitches do not top the mid-80s and he is getting slower every year.9 So how does this scrawny pitcher become subject to Cy Young talk every year? Well, to start, he has pin-point accuracy on his pitches, a variety of pitches, and an economics degree (with a minor in mathematics).

Kyle Hendricks, nicknamed “The Professor,” studies opposing hitters. Leading up to every game he goes through the entire batting lineup of a team, finding each batter's weaknesses and strengths and using it against them. With each at-bat, he goes in with a strategy. While Hendrick’s keeps most of his secrets to himself and his coaches, the sabermetricians are beginning to figure him out. Starting every at-bat, Hendricks “steals” a strike. The Professor has a belief that most hitters in the league will take on the first pitch to adjust to a pitcher, especially to a multi-pitch freak like himself. Hendricks is second in the league in first-pitch strikes, and averages almost 3 called first-pitch strikes for every swinging one.10 It as if hitters have just given up on the first pitch.
Additionally, Hendrick’s uses coach and hitter expectations to form his pitching style. He does this in two main ways. First, he has additional pitches that remain hidden, in addition to his already extensive known repertoire. For years he got away with a second changeup that was only relieved when sabermetricians noticed discrepancies between his changeup velocity and breaks.11 It was also found that he had a second curveball which has shown increased use over the years.12 Second, he goes against “conventional baseball wisdom” in pitch selection. While most baseball pitchers rely on the fastball as a primary pitch and breaking balls as a secondary pitch, Hendricks uses all his pitches with relative frequency. He lacks the primary-secondary pitch sequence. In complete ire of traditional baseball pitching style, Hendricks throws his changeup at a greater frequency (24.27%) than his four-seam (15.85%).13
Breaking New Ground with Game Theory
Although statistics have been an important part of baseball for the past 20 years, newer forms of mathematical thinking like game theory have yet to catch on. While few baseball players have any academic experience with game theory, a simplified version is well understood by every baseball player. Basically, an AB is much like a game of matching pennies. The pitcher benefits from a disagreement, while the batter benefits from an agreement. A good pitcher will thus try their best to create uncertainty for a batter.
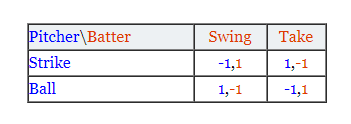 Simplified version of a zero-sum matching pennies game applied to baseball. [15]
This is, of course, an oversimplified version of the baseball. Adding variables like batter/pitcher matchup, men on base, score, inning, lineup, etc all would make the game more and more complicated, and requires an analysis that would exceed the capacity I am willing to do for this blog post. An illustration of this complexity can be found from a UC Berkeley paper on the 8th inning of a game between the Giants and Dodgers14. Game theory has also begun to creep into the amateur baseball blogs15.6 Perhaps in the future game theory will take over the baseball world.
So far, the limit of game theory in baseball has been in an academic context. A great analysis of a game can be found here. This paper analyzes the 8th inning the April 18th, 2010 game between the LA Dodgers and the San Francisco Giants. Although this paper features just two batters in one-half inning it illustrates how game trees in baseball quickly become complex. Perhaps the greatest challenge to game theory and baseball has been the complexity involved. So many factors have to be taken into consideration for something as simple as where to pitch.
To conclude, baseball has become a bit of a hobby for economics, mathematics, and statistics majors like myself. Through the sport’s unique design, a fan can participate, not as a player, but an analyst. Through the democratization of information via the internet, being a baseball fan is a totally different experience than 50 years ago.
______Featured image: Citizens Bank Park looking north toward central Philadelphia. Photo credit: Penn State Bibliography Puerzer, R. J., (2002) From Scientific Baseball to Sabermetrics: Professional Baseball as a Reflection of Engineering and Management in Society. NINE: A Journal of Baseball History and Culture (11)James, B., Birnbaum, P., Roney, S., Pavitt, C., Palmer, P., Blau, C., . . . Mednick, B. (n.d.). Baseball Analyst archives. Retrieved from http://sabr.org/research/baseball-analyst-archivesLewis, M. (2003). MoneyBall. New York, NY: W. W. Norton & Company.List of current Major League Baseball general managers. (2017, October 2). Retrieved from https://www.baseball reference.com/bullpen/List_of_current_Major_League_Baseball_managersJohns, G. (2015, September 28). Jerry Dipoto named Mariners general manager.Fangraphs Writers. (2017, September 15). Retrieved from https://en.wikipedia.org/wiki/Fangraphs#Regular_writersSilver, N. (2004, January 15). PECOTA Takes on the Field: How'd it Fare Against Six Other Projections Systems?Oakland Athletics Team History & Encyclopedia. (n.d.). Retrieved from https://www.baseball-reference.com/teams/OAK/index.shtmlKyle Hendricks. (2017, October 25). Retrieved from http://www.fangraphs.com/pitchfxo.aspx?playerid=12049&position=P&pitch=SI&data=piEckert-Fong, T. (2016, August 17). Why do hitters rarely swing at first pitches from Kyle Hendricks? Retrieved from https://www.beyondtheboxscore.com/2016/8/17/12505864/kyle-hendricks-cubs-first-pitch-strike-swingSarris, E. (2015, October 20). Kyle Hendricks Has Two Changeups. Retrieved from https://www.fangraphs.com/blogs/kyle-hendricks-has-two-changeups/Weinberg, N. (2016, October 28). The Evolving Curveball of Kyle Hendricks. Retrieved from https://www.fangraphs.com/blogs/the-evolving-curveball-of-kyle-hendricks/Kyle Hendricks: Trajectory and Movement. (n.d.). Retrieved from http://www.brooksbaseball.net/tabs.php?player=543294&time=&startDate=03%2F30%2F2007&endDate=09%2F30%2F2017&s_type=2Geblem, Laucys, Saperstein, & Sodha. (2010, May 13). The Game Theory of BaseballSwartz, Matt. “Game theory and baseball, part 1: concepts.” The Hardball Times, Fangraphs, 17 Dec. 2012, www.fangraphs.com/tht/game-theory-and-baseball-part-1-concepts/.Greenberg, G. (2010, Fall). Does a Pitcher's Height Matter? Retrieved from http://sabr.org/research/does-pitcher-s-height-matter Further Readinghttp://www.mathaware.org/mam/2010/essays/AlbertSabermetrics.pdfhttp://sabr.org/sabermetrics


